Federal Tax Contribution by State: Which States Pay the Most

- Mississippi residents have the lowest average federal tax burden, at $2,883 per adult resident.
- Floridians have seen the biggest increase in their federal income tax bills.
- Average personal income tax burdens rose in 48 of the 50 states plus the District of Columbia over the last five years.
Tax season reminds everyone how much they provide revenue to support federal funding and the budget.
A state-by-state examination of tax data found that while people everywhere contribute dollars to the federal government, people in some states clearly pay more than others.
What State Pays the Most in Taxes?
IN THIS ARTICLE
- What State Pays the Most in Taxes?
- Total Federal Taxes Paid by State
- Federal Income Taxes Paid Per Capita
- Tax Burden as a Percent of Income
- Biggest Percent Increase in Federal Income Taxes
- Changes Expected in Next Year’s Study
- Methodology
- Planning Your Tax Strategy
- Federal Taxes Paid by State – Full Listing
If you’re wondering who pays the most federal taxes, it depends on how you look at it. These four perspectives highlight the differences from state to state:
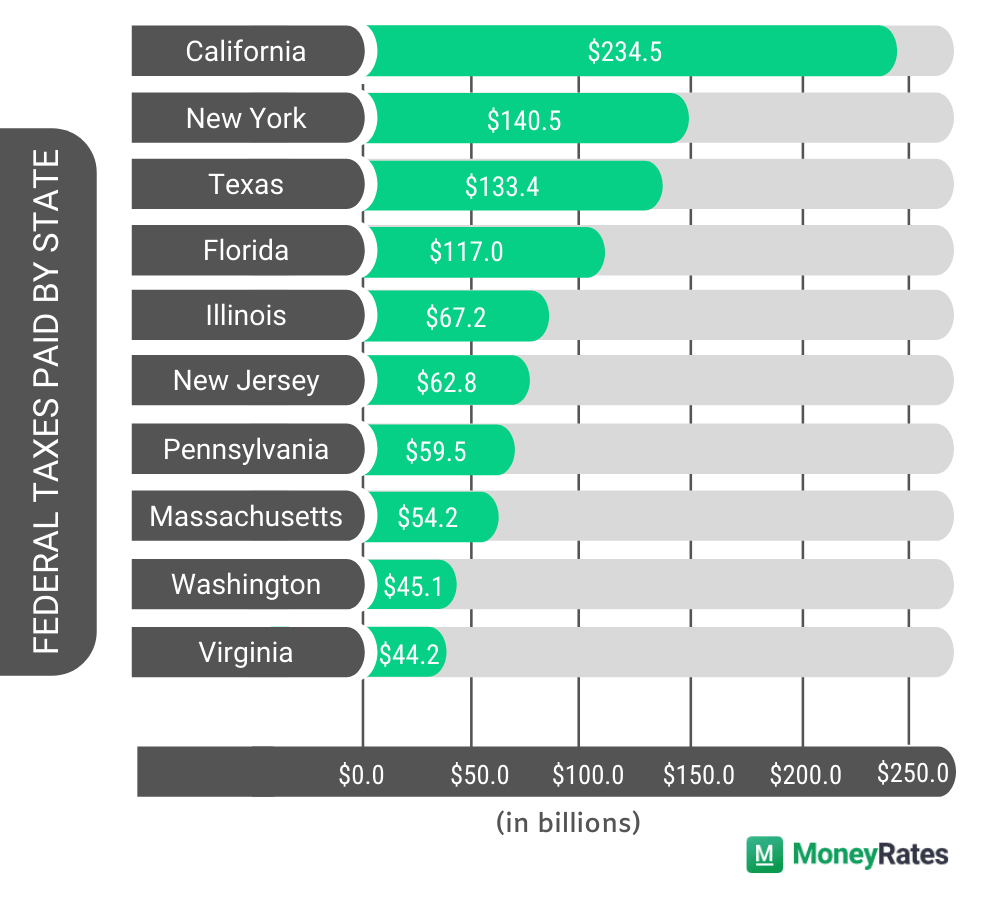
Most individual taxes – California – $234.5B
California ranks highest for the most individual taxes paid to the federal government.
As of the most recent tax year for which data is available, Californians paid over $234 billion in federal income taxes. That’s about 15% of the national total and nearly 95 times as much as paid by residents of Vermont.
Which Investments Are Best for Saving on Taxes?
Adding income to some investments, like 401(k)s, can save you money on taxes. Explore investment platforms and find the best brokerages.
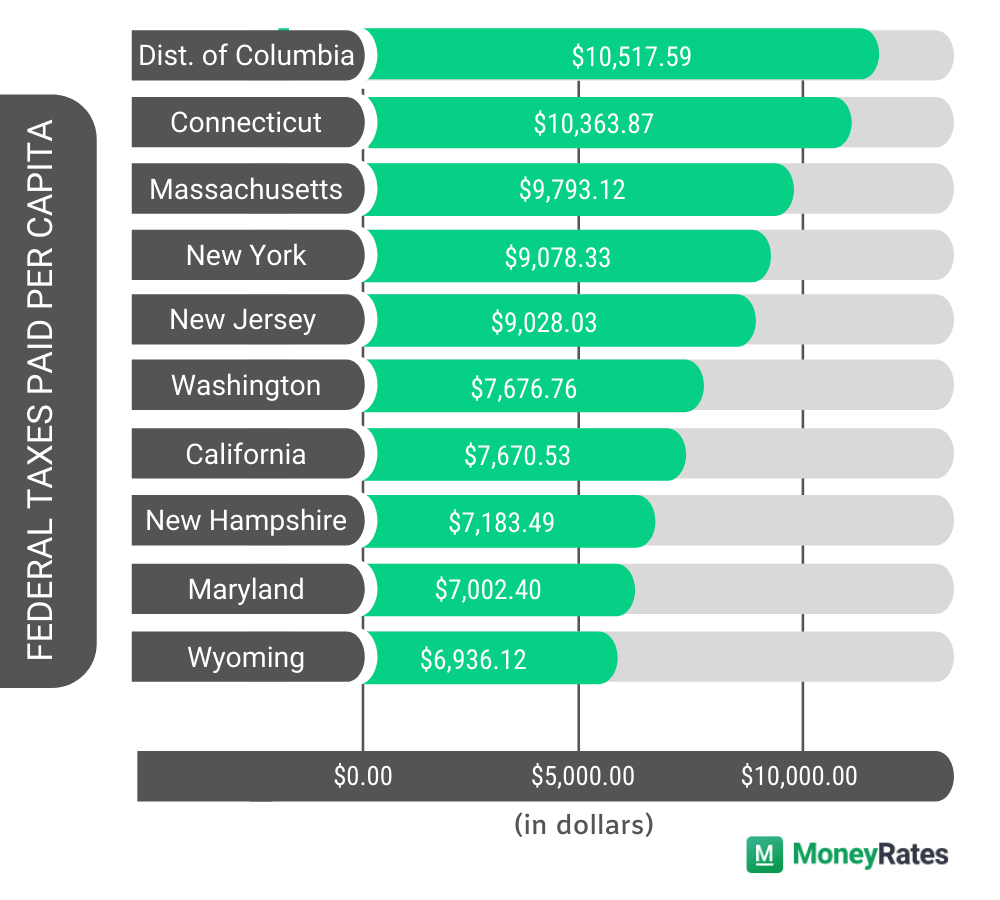
Most per adult resident – Connecticut – $10,364 individually
Connecticut pays the most per adult resident of any state, at $10,364 per person.
Even though residents of Washington, D.C. pay more ($10,518), the tax burden shouldered by people in Connecticut is more than three times the national average of $2,883 paid by Mississippi residents.
Highest percentage of income – Washington, DC – 17.40% of income
Residents of Washington, D.C. also pay the highest percentage of their income in federal taxes, at an average of 17.40%. That’s a rate more than 60% higher than the national average 10.67% paid by residents of Mississippi.
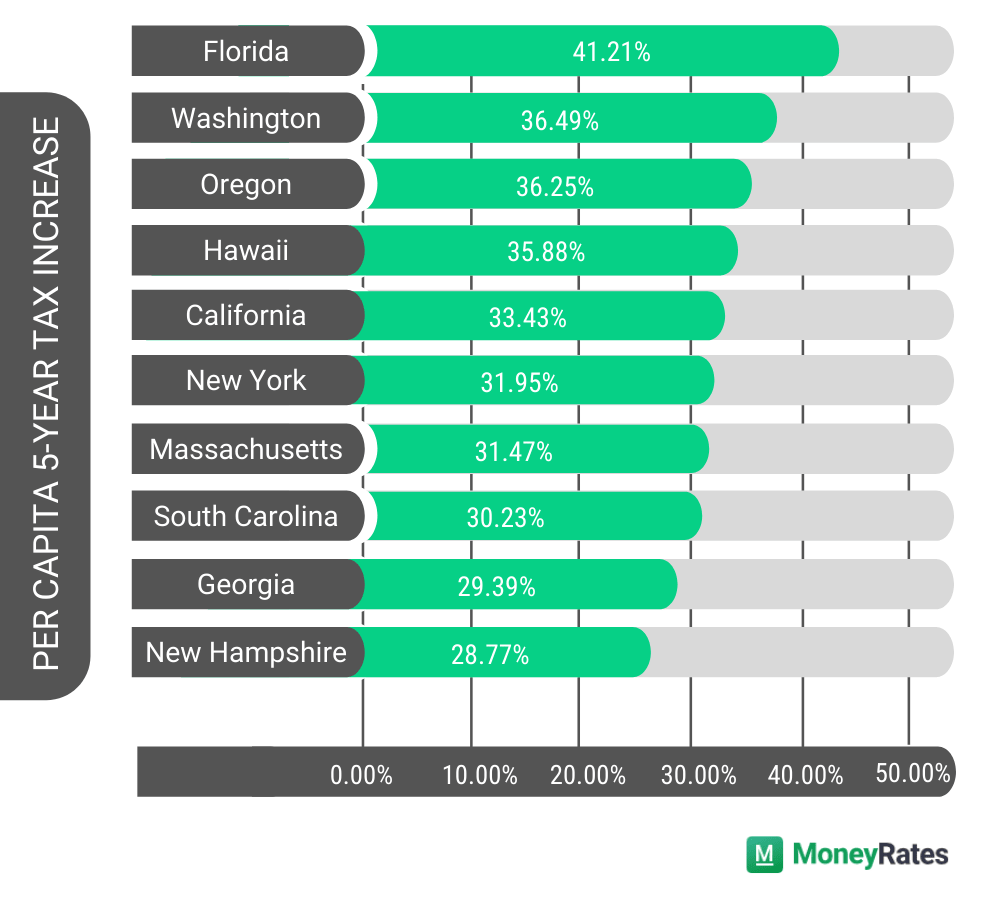
Greatest increase in federal tax burden per adult resident – Florida – 41.21%
Over the five years since this study was first conducted, Florida saw the biggest increase in the federal tax burden paid per adult, with a rise of 41.21%.
In contrast, the average tax burden paid by people in North Dakota shrank by 15.32% over that same period.
Total Federal Taxes Paid by State
California has the largest population of any state, and those residents earn a relatively high average income. When you combine those two factors, it’s no surprise that California residents pay more than those of any other state.
Vermont pays the least in federal income taxes, about $2.5 billion. It has the second-smallest adult population of any state and a below-average adjusted per capita income.
The top 10 states in terms of total federal income taxes paid are displayed in the table below:

Federal Taxes Paid Per Capita
Though it has an adult population of just 575,000 and is not a state, D.C. has one of the highest average income rates at $60,435 per adult resident. High average incomes tend to mean high tax burdens, which is why D.C. tops the list of federal income taxes paid per adult.
Mississippi residents have the lowest average federal tax burden, at $2,883 per adult resident. However, this federal money alone is nothing to celebrate because it’s the lowest average-income state compared to the other 49 states.

Tax Burden as a Percent of Earnings
In general, taxes to the federal government are based on income levels, but other factors also affect your tax burden. How you make money and what kind of deductions you claim also have an impact.
D.C. topped the list, but Mississippi was the only state where adult residents paid less than 11% of their income in federal taxes. The average percentage of the federal tax burden in Mississippi is 10.67%.
Looking at federal taxes paid as a percentage of income yields several of the same names that appeared on the page for the list of taxes paid per person, but note that there are also some differences.

Biggest Percent Increase in Federal Income Taxes
MoneyRates first conducted this study of what residents of different states pay in federal taxes five years ago. People in most states are paying more now than they were then, but there are a couple of exceptions.
On average, people in Florida have seen the biggest increase in their federal income tax bills. The average federal tax paid per adult in the state of Florida has risen by 41.21% in just five years.
Over the last five years, average personal income tax burdens rose in 48 of the 50 states plus the District of Columbia. The lone exceptions were Wyoming and North Dakota. Notably, these are two of only three states that have seen a decline in average income per adult over the same five years.
Here are the states that have seen the largest percentage increases in average tax burden per person in the past five years:

Methodology
The IRS provided data on taxes and income levels, while the U.S. Census Bureau provided data for the adult population of each state and the District of Columbia.
This study focused on individual income taxes only. The per capita revenue figures were calculated by dividing the total taxes paid by individuals in each state by the number of adult residents of that state.
The tax burden as a percentage of income was calculated by dividing the total taxes in each state by the declared income on tax returns from those states. The 5-year percentage increase was calculated by comparing this year’s per capita tax burden with the per capita tax burden from the original study conducted in fiscal year 2015.
Tax Preparation Fees: What It Costs to Get Your Taxes Done
Federal Taxes Paid by State – Full Listing
FAQs
California.
In 2021, Alaska received the most federal dollars per person, at $7,618.
In 2022, California paid $692 billion in taxes to the federal government, which was more than any other state.
California is the state that generates the most revenue in the United States, both in terms of tax revenue and GDP.